Charting in Family Tree Maker
by Geoffrey Slinker
Copyright 2015
In 2007 I switched development teams at Ancestry.com to help with the charting for Family Tree Maker. Since I have a Masters Degree in Computer Science with my focus being Computer Graphics I thought it would be a great opportunity for me to contribute to the features of Family Tree Maker. The team was made of some of the smartest and nicest people I have had the privilege to work with. The task ended up being one of the most challenging assignments I have ever undertaken. In short I had to develop an entirely new graphics and layout engine from scratch. I also invented two new layouts for genealogical data which resulted in two patents. It was very rewarding to have helped create such a fine and useful application.
I left the Family Tree Maker team in 2011. There were some features that we wanted that never got finished. But, the ability of Family Tree Maker to make very pleasing charts is there for those that take the time to learn how to use the app.
To learn how to use Family Tree Maker Charting to the fullest it is important to understand how the charting works. I had intended to write a book on how to fully utilize charting, but never got around to it. However, I did make a rough draft of what I wanted the book to convey. You can find it here.
Also, there were several features that I was experimenting with that never made it completely into the User Interface. However, these undocumented features were there and there are special key combinations that I used to activate the features so that I could experiment with them. Some of those undocumented features still exist in Family Tree Maker for Windows. You can read about them here.
I do not provide support for Family Tree Maker. I will not respond to emails or comments. This information's sole purpose is to be informative and makes no claims to the accuracy of this information with the current version of Family Tree Maker.
Genealogical research often represents information that you want to display. Sometimes that display is very simple and to the point, no frills, but other times the information is displayed not only to show the data but to be pleasing to look upon.
Now granted, I do have an advantage over most users because I wrote the charting code and understand how to get the most out of it, but with a little practice you can make charts that look like these!

Above is a Bow Tie Chart. I selected colors for the boxes to match the colors found in the background image. From the embellishments I added an image, made it transparent, and moved it behind the title. I selected fonts and font sizes that I liked for the names and facts (Fonts button on the chart options).

Above is a Tree Chart. I found an image of trees that I liked and set it as the background and to soften it I set its transparency to 65%. I kept the boxes simple and in the Box, Borders, and Lines options I made the boxes "Semi-transparent" and set the fill color to none.

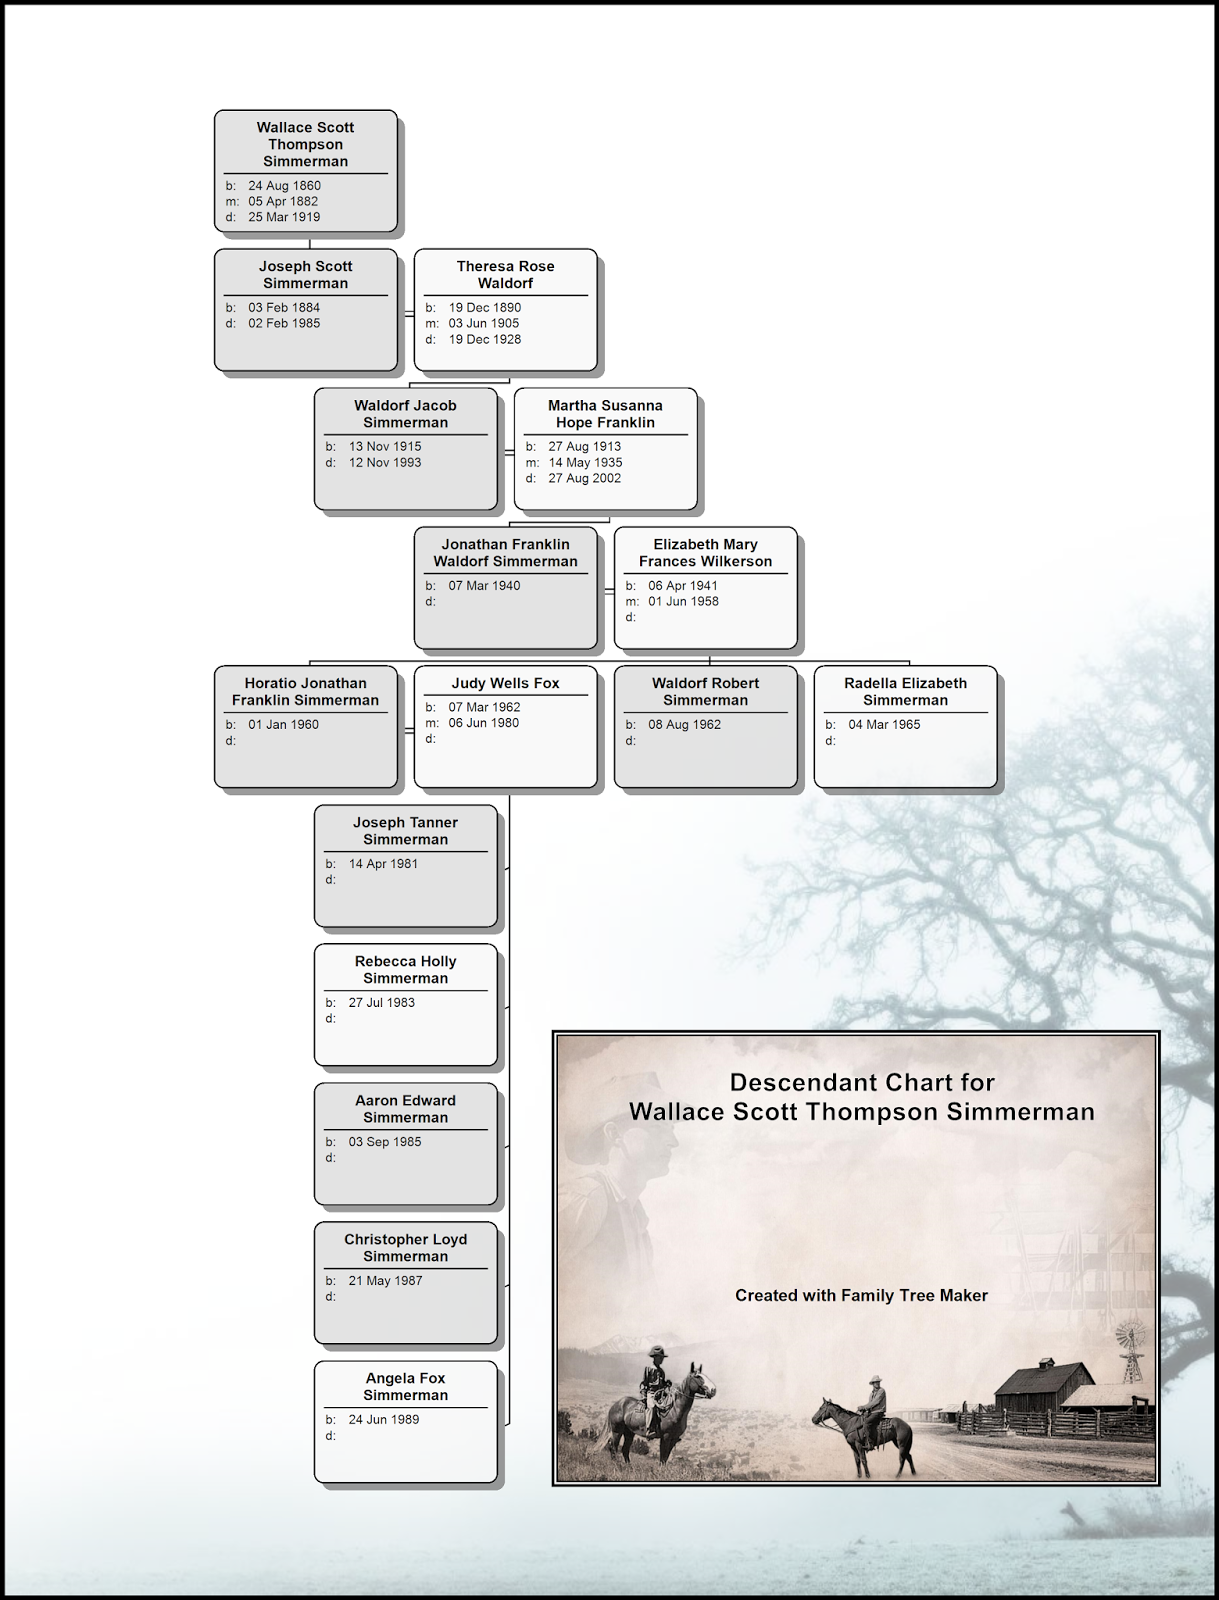
The above chart is a Descendant Chart. I selected a background from those provided with Family Tree Maker. I checked the "Last descendant generation vertically" and made the boxes semi-transparent. I used an outline font on the chart title.

Above is a Pedigree Chart. I set the chart background color to be a shade of blue (you do this in the Box, Border, and Line Options dialog). I added a background image and made it 80% transparent. The nodes in the tree have no fill color, rounded corners, a shadow, and all boxes are the same size.

Above is a pedigree chart that has four images added, one for each corner.

Above is a Pedigree Chart. The divider lines in the boxes has been set to midnight blue. The boxes have rounded corners and use a gradient fill, and there is a light gray shadow.

The Pedigree Chart above is what I call a photo album. From the Items to Include dialog, I added the life span, a divider line, several blank lines, a divider line, and the name. In the chart options I selected to use the photo aligned "Top" and positioned "Behind" and also checked "Use silhouettes".
The Vertical Descendant Chart above has checked "Last descendant generation vertically", a background with 50% transparency, an image inserted which has the chart title placed inside and above the image as well as a text note.

The Vertical Descendant Chart above has checked "Last descendant generation vertically", a background with 60% transparency, a soft lemon yellow chart background color, an image inserted which has the chart title placed inside and above the image as well as a text note. The image uses an undocumented feature that allows you to set the transparency of the image, that is why you can see the background image bleeding through.

Above is a Pedigree Chart with a background image with transparency set to 40% and vertical gradient transparency (an undocumented feature) applied to the nodes.
I hope this shows you some of the potential of charting in Family Tree Maker for Windows and inspires you to make some lovely charts for yourself or to share and give to your family members and friends.
Please share the link to this post, but do not copy the data, this is copyrighted data that is not public domain.