Charting Secrets of Family Tree Maker
by Geoffrey Slinker
Copyright 2015
Charting in Family Tree Maker has a few undocumented features in the Windows version.
Feel free to share the link to this post, but do not copy the contents of this post. This is not public domain information.
I do not provide support for Family Tree Maker. I will not respond to emails or comments. This information's sole purpose is to be informative and makes no claims to the accuracy of this information with the current version of Family Tree Maker.
I do not provide support for Family Tree Maker. I will not respond to emails or comments. This information's sole purpose is to be informative and makes no claims to the accuracy of this information with the current version of Family Tree Maker.
These undocumented features of Family Tree Maker are the results of experiments for new features that I never had time to fully develop. Therefore you should be aware that because I am (or rather was) the only person that ever knew about these features that they have not been tested, and they are not supported. Because of this, there may be bugs, so I only recommend using these features on a copy of your FTM data. I don’t think you would want your data to be corrupted just to get a fancier border on a node or image. Use these undocumented features at your own risk.
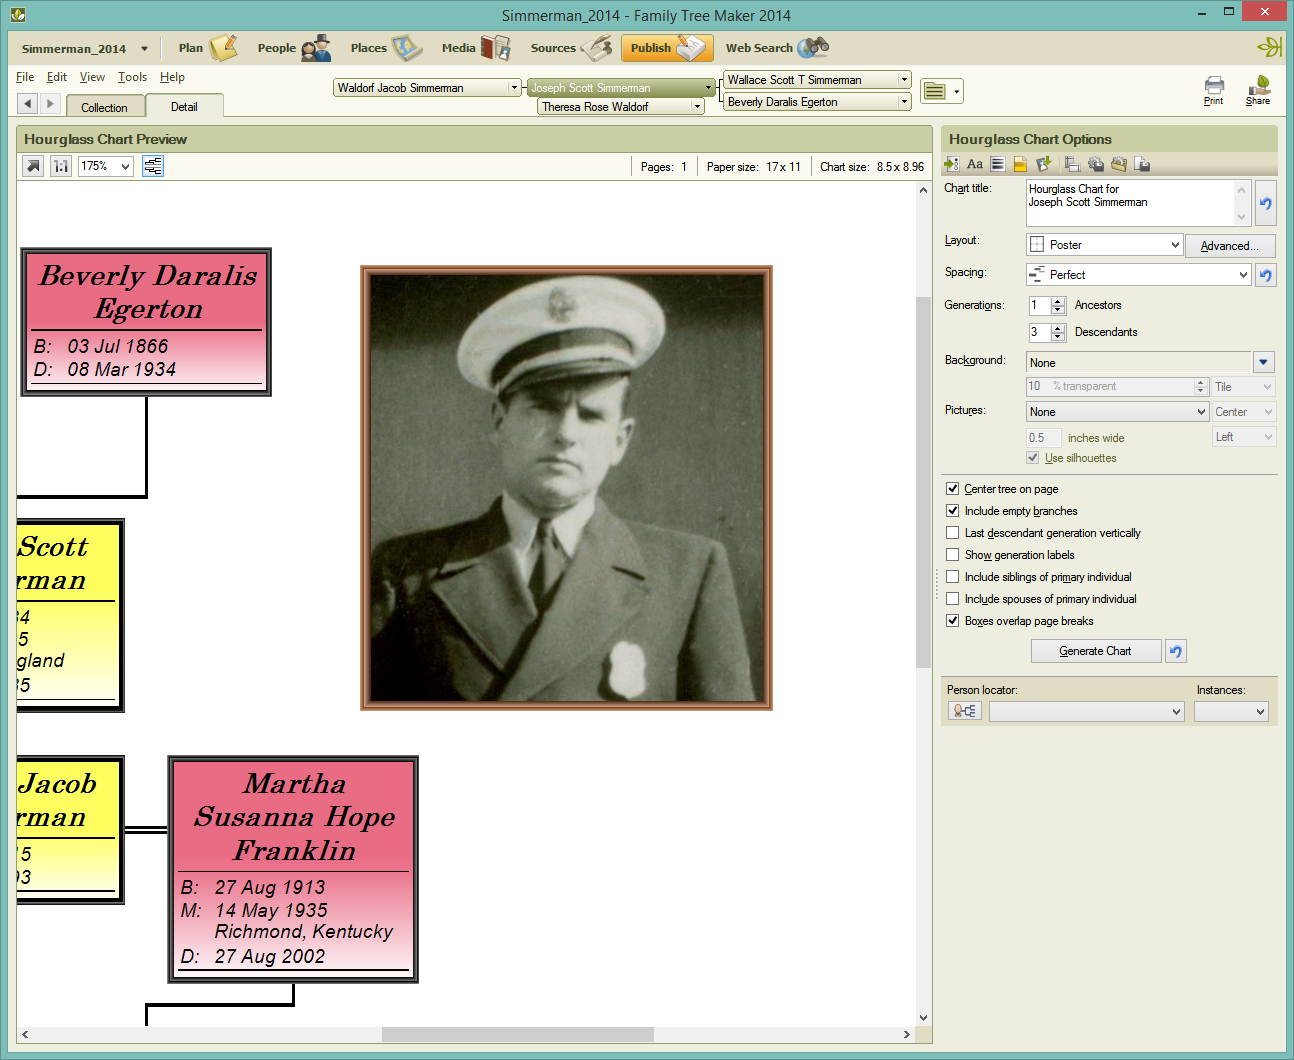
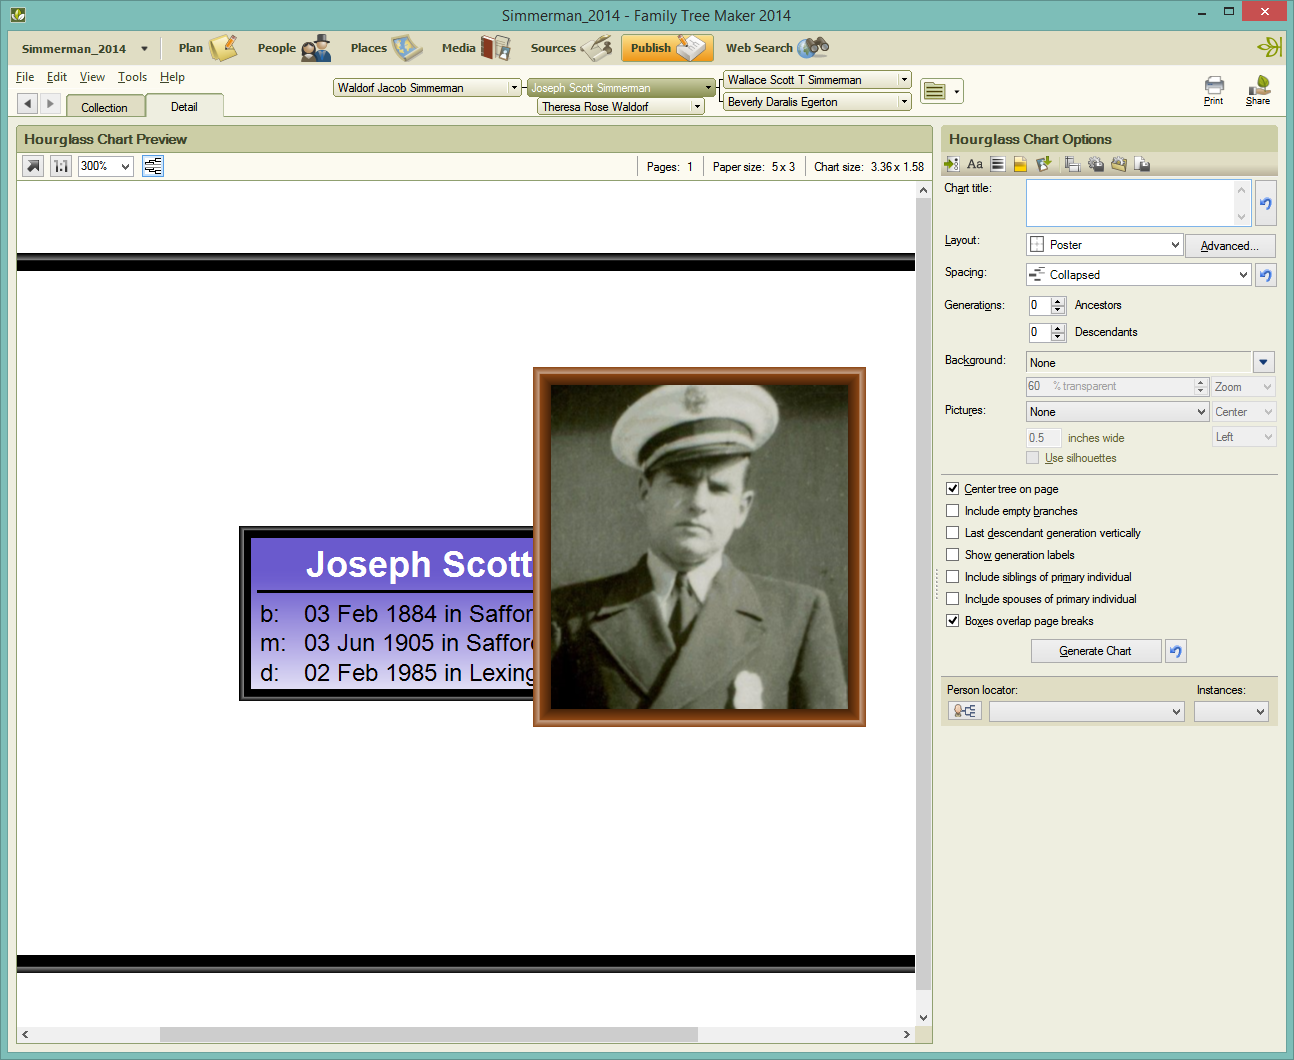
Below you can see some of them applied. Notice the person boxes (nodes) have a special kind of border and a special fill that is a vertical transparency where the transparency is a gradient. Notice that the node is 100% transparent at the bottom of the node and 0% transparent at the top of the node.
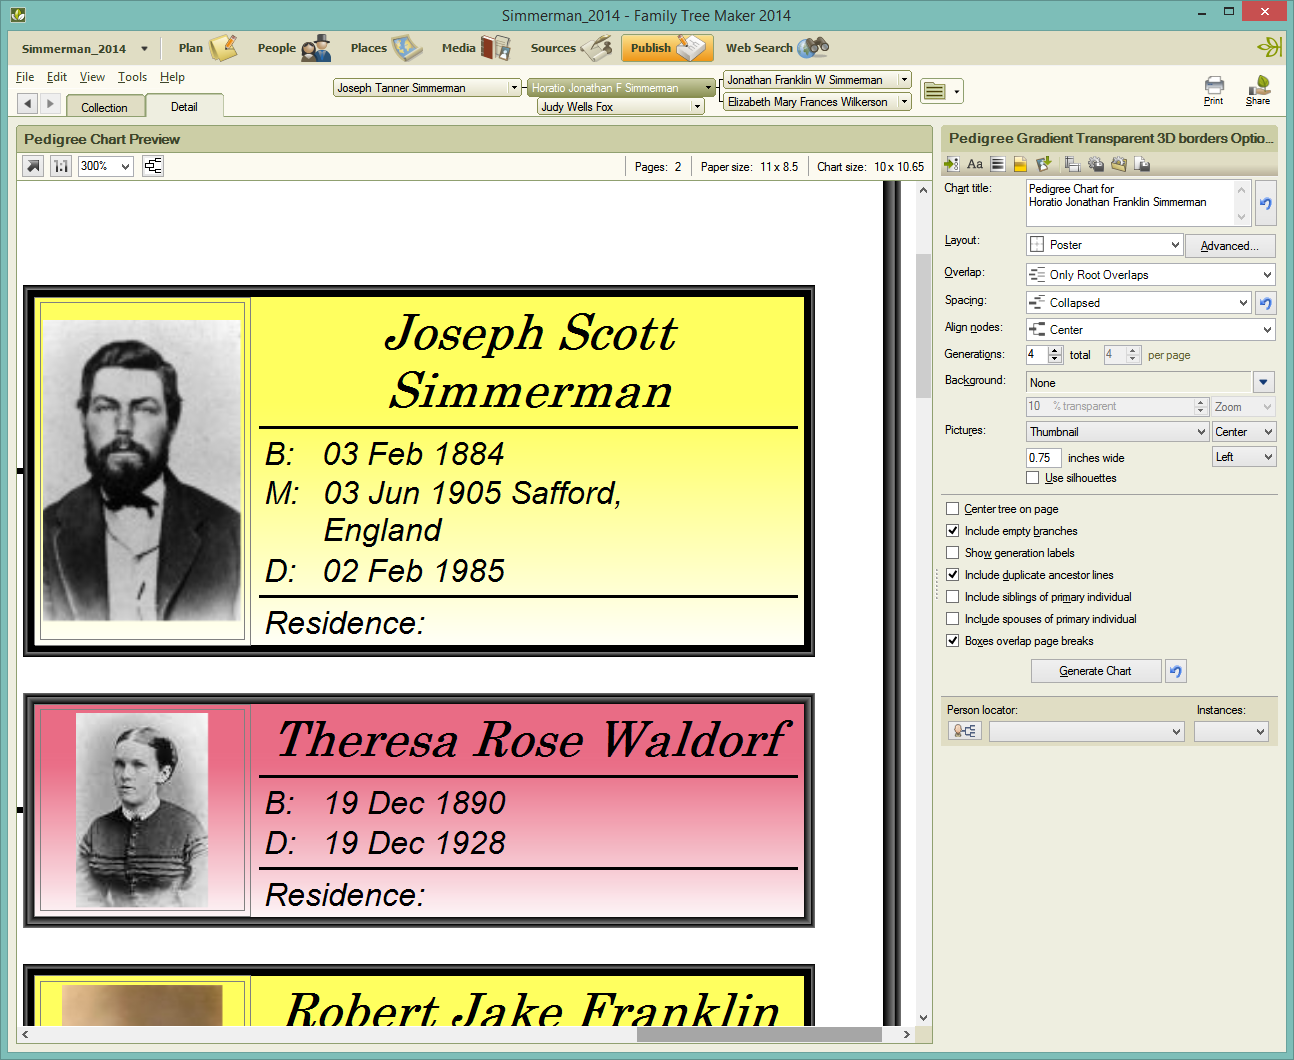
Also, on the left you can see the chart’s border which is not a standard two line border.
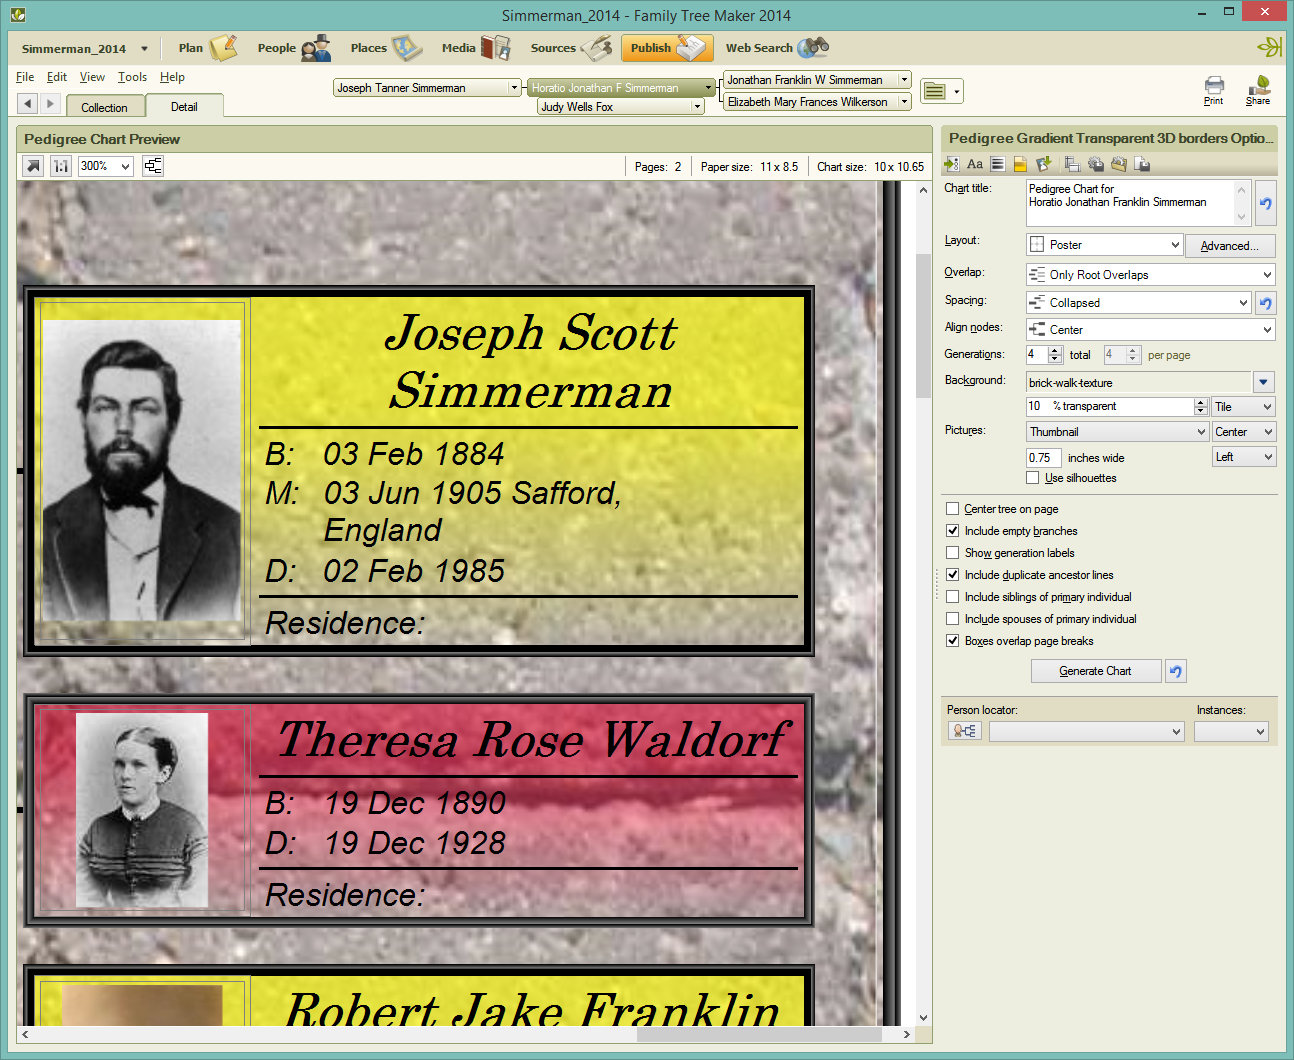
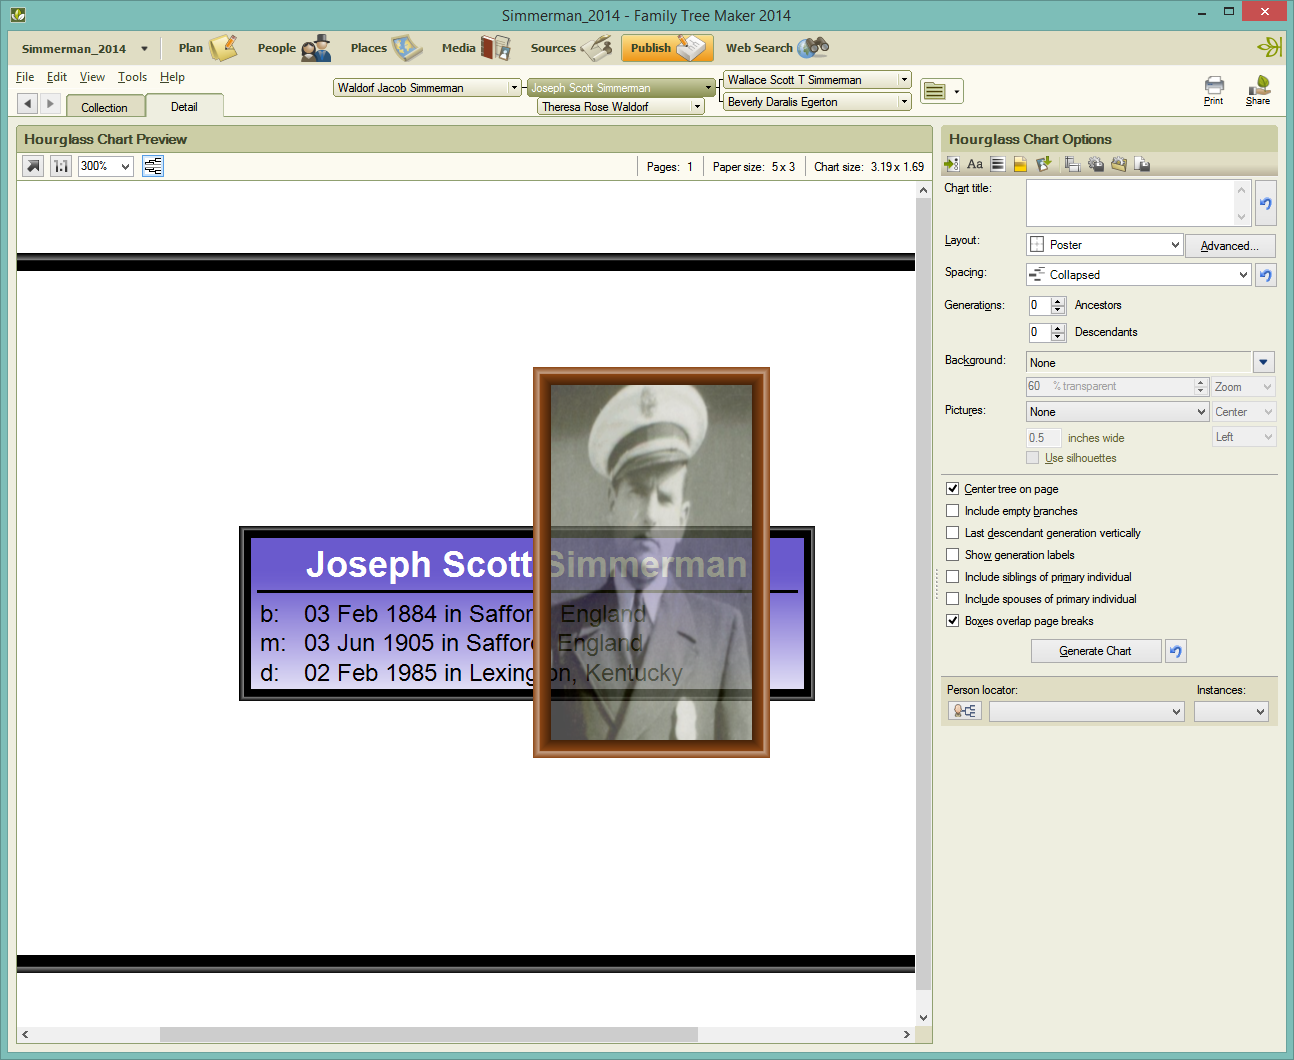
I will add a background pattern to the chart so that you can more readily see the gradient transparency.
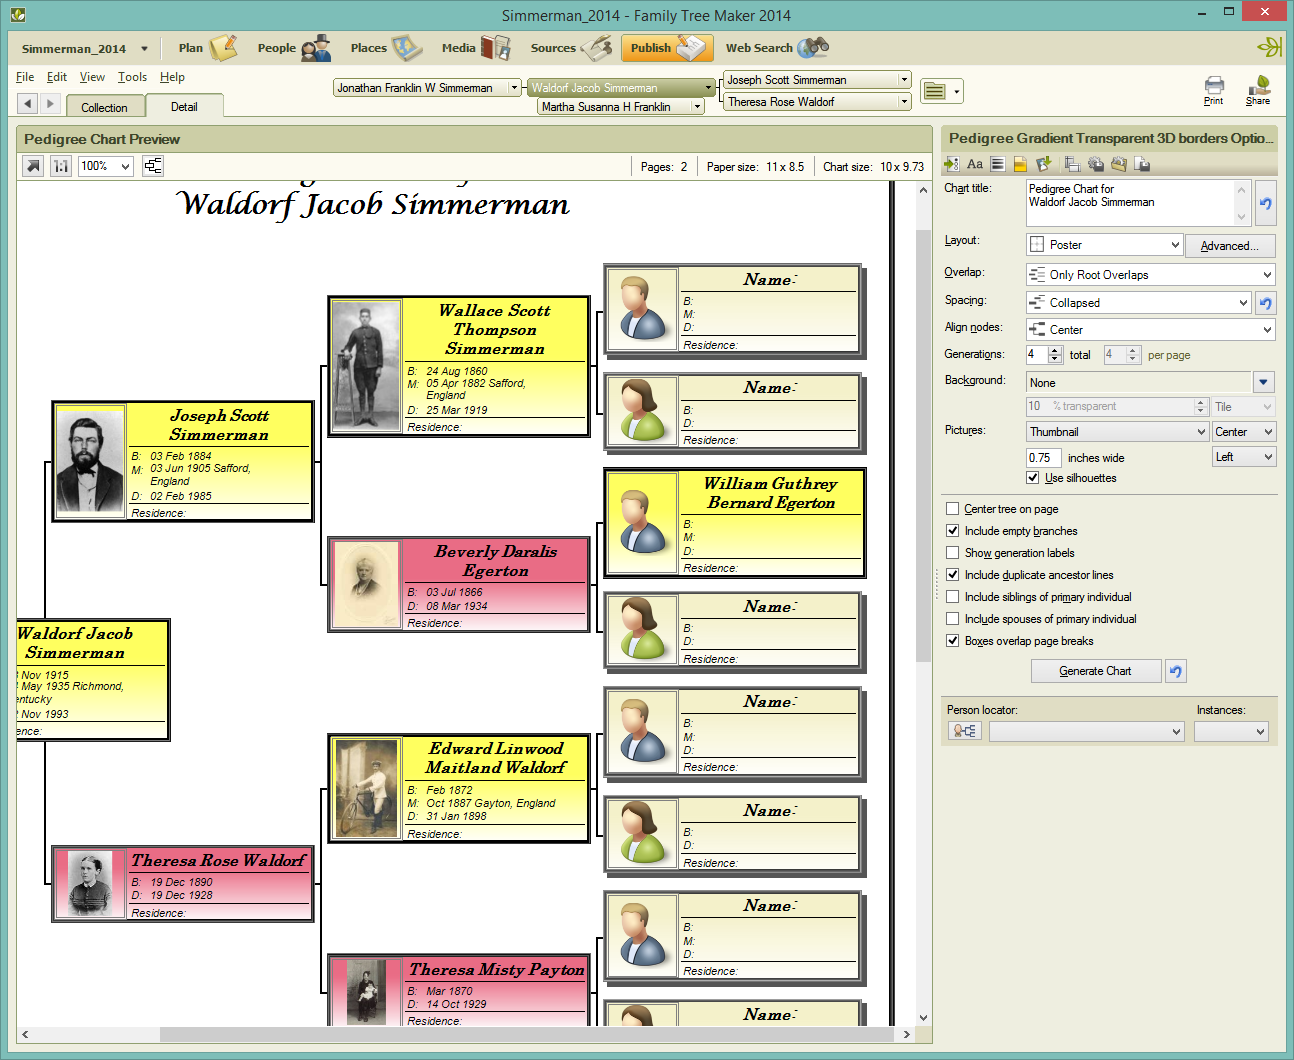
You can change the silhouette used when there is no image for the person.
You can even supply your own custom silhouette image.

For the vertically oriented charts you can make the last generation be displayed vertically.
There is an undocumented feature that will make all of the children be listed vertical if there are no others below those children which tightens up the chart’s width.

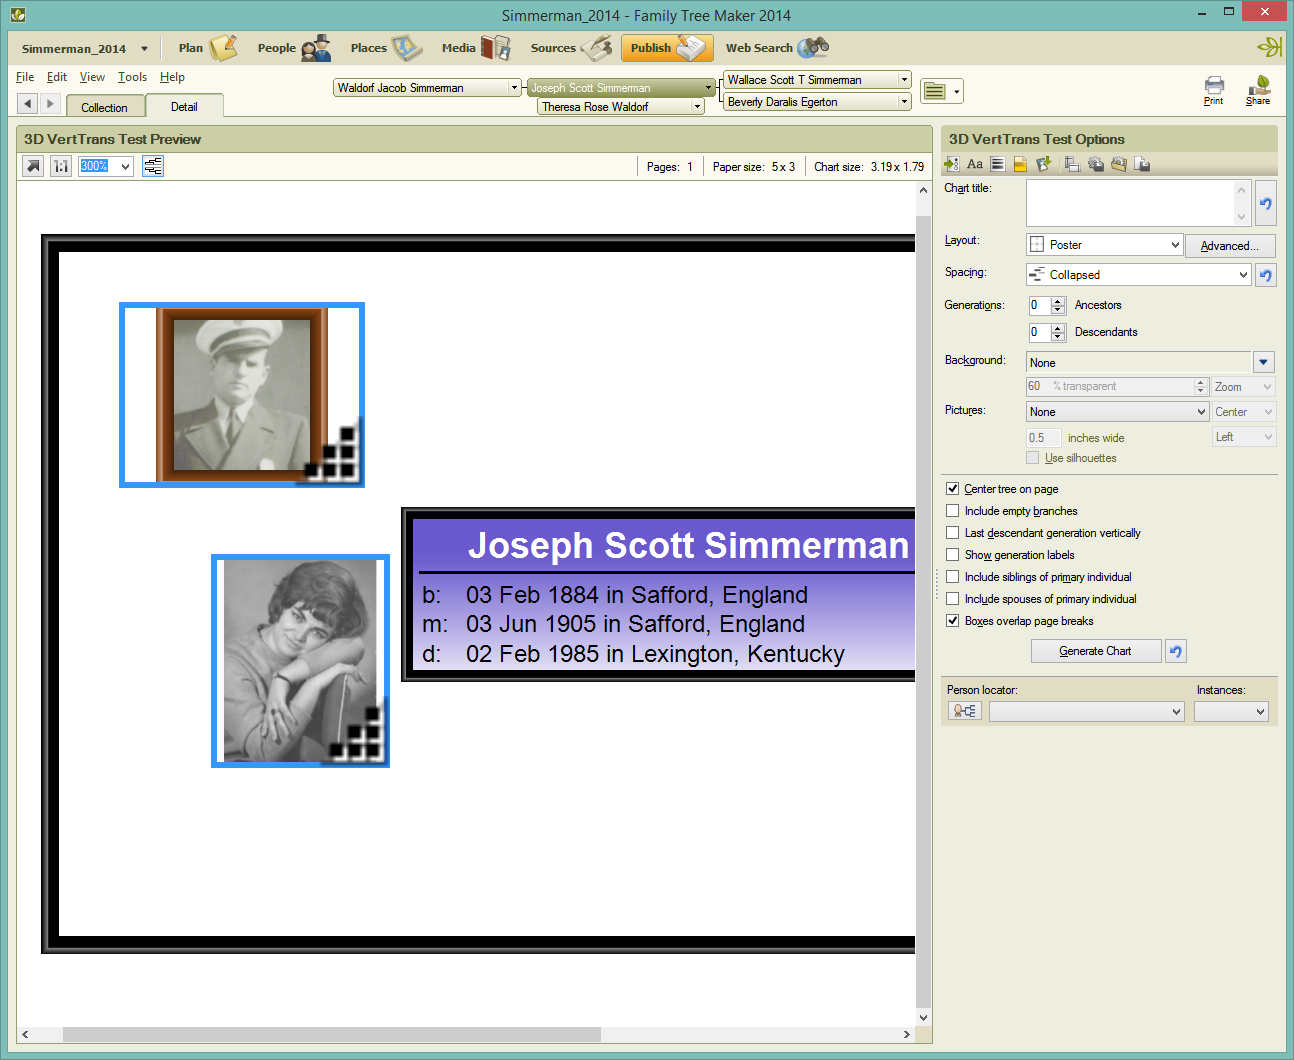
There are undocumented borders you can apply to inserted images.
There is an undocumented feature that allows you to change the transparency of an inserted image.
These undocumented features of Family Tree Maker are the results of experiments for new features that I never had to to develop fully. Therefore you should be aware that because I am (or rather was) the only person that ever knew about these features that they have not been tested, and they are not supported. Because of this, there may be bugs, so I only recommend using these features on a copy of your FTM data. I don’t think you would want your data to be corrupted just to get a fancier border on a node or image.
Chart Boxes (Nodes)
The undocumented features of a chart node are:
- Vertical Gradient Transparency
- 3D borders
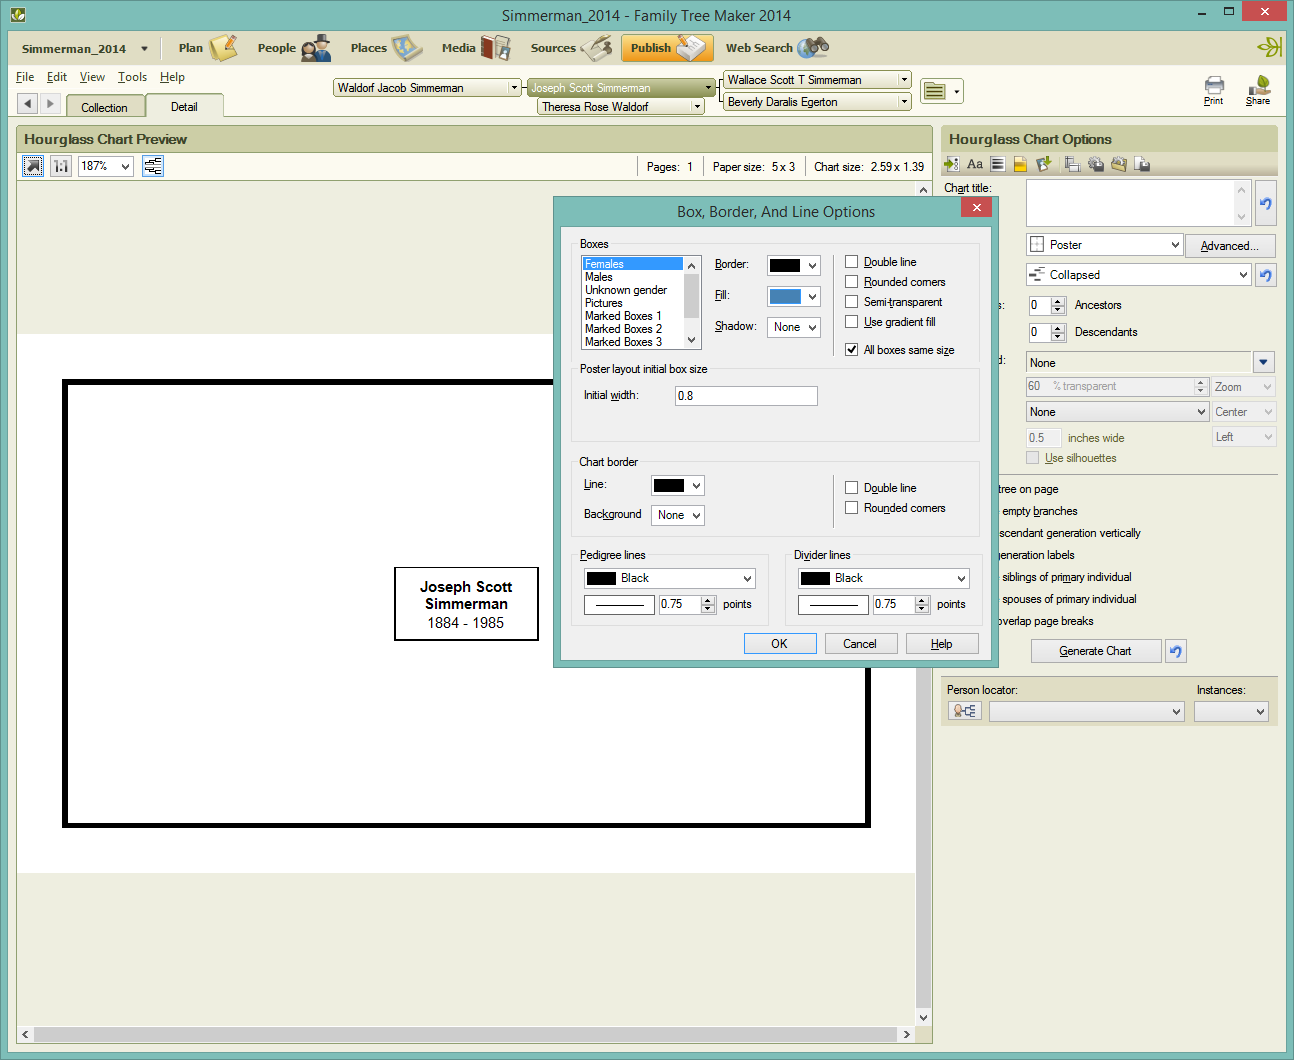
These undocumented features are accessed through the Box, Border, and Line Options dialog. It is a little tricky, so pay attention.
In the Box, Border, and Line Options you have to click in the list at the top left, the list is titled Boxes. You have to click this list each time before you do a key sequence.
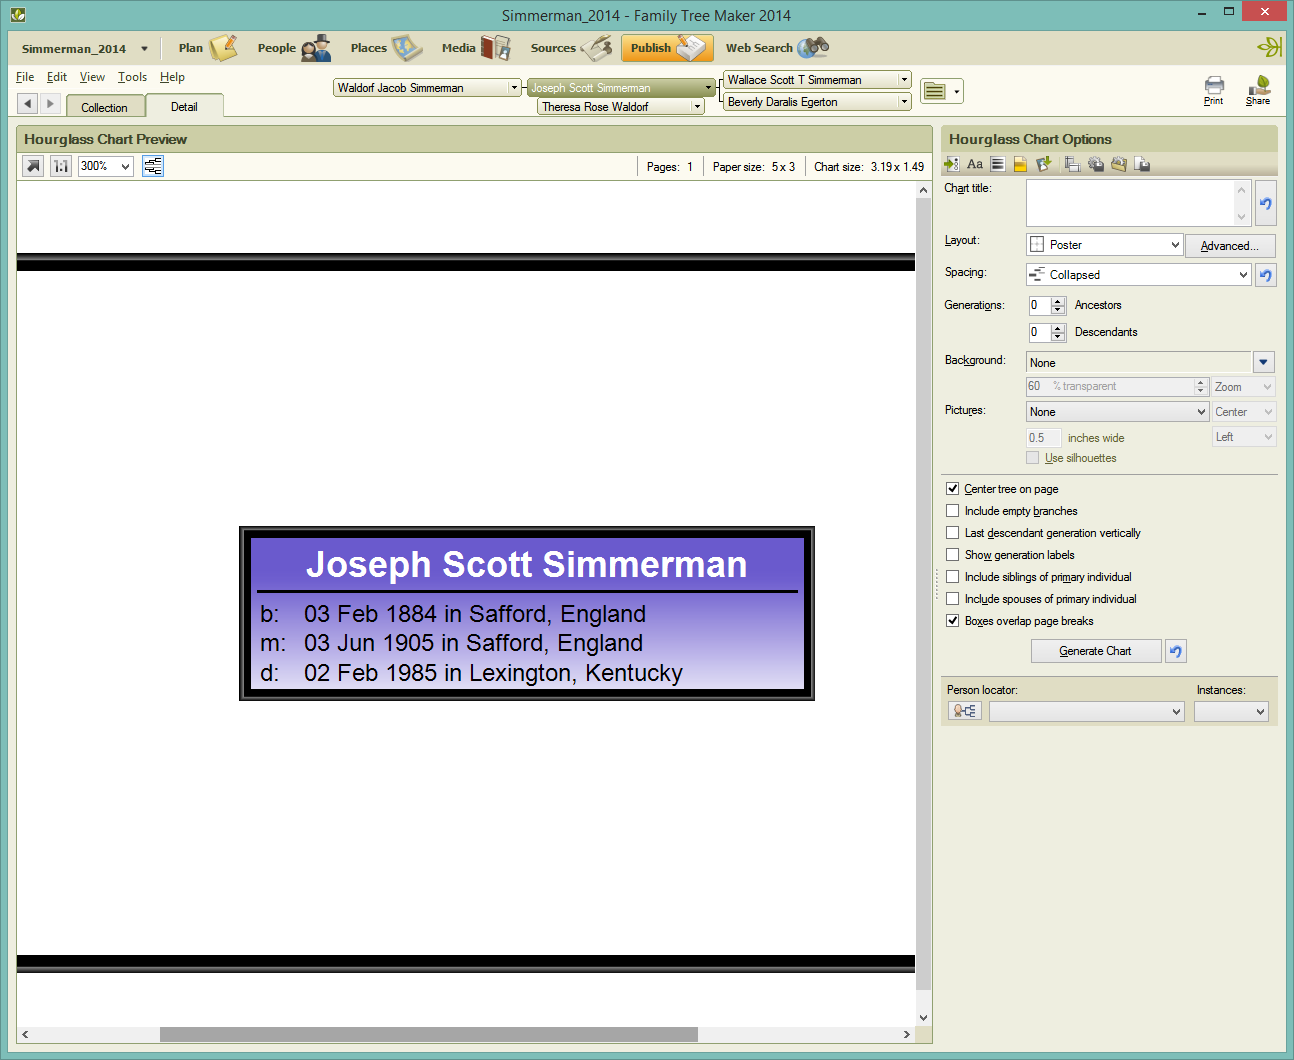
To see the vertical transparency the box needs a fill color.
All person boxes (Females, Males, and Unknown) will get the vertical transparency setting.
Click in the “Boxes” list box and then hold the Control Key and the Shift Key and press the t key.
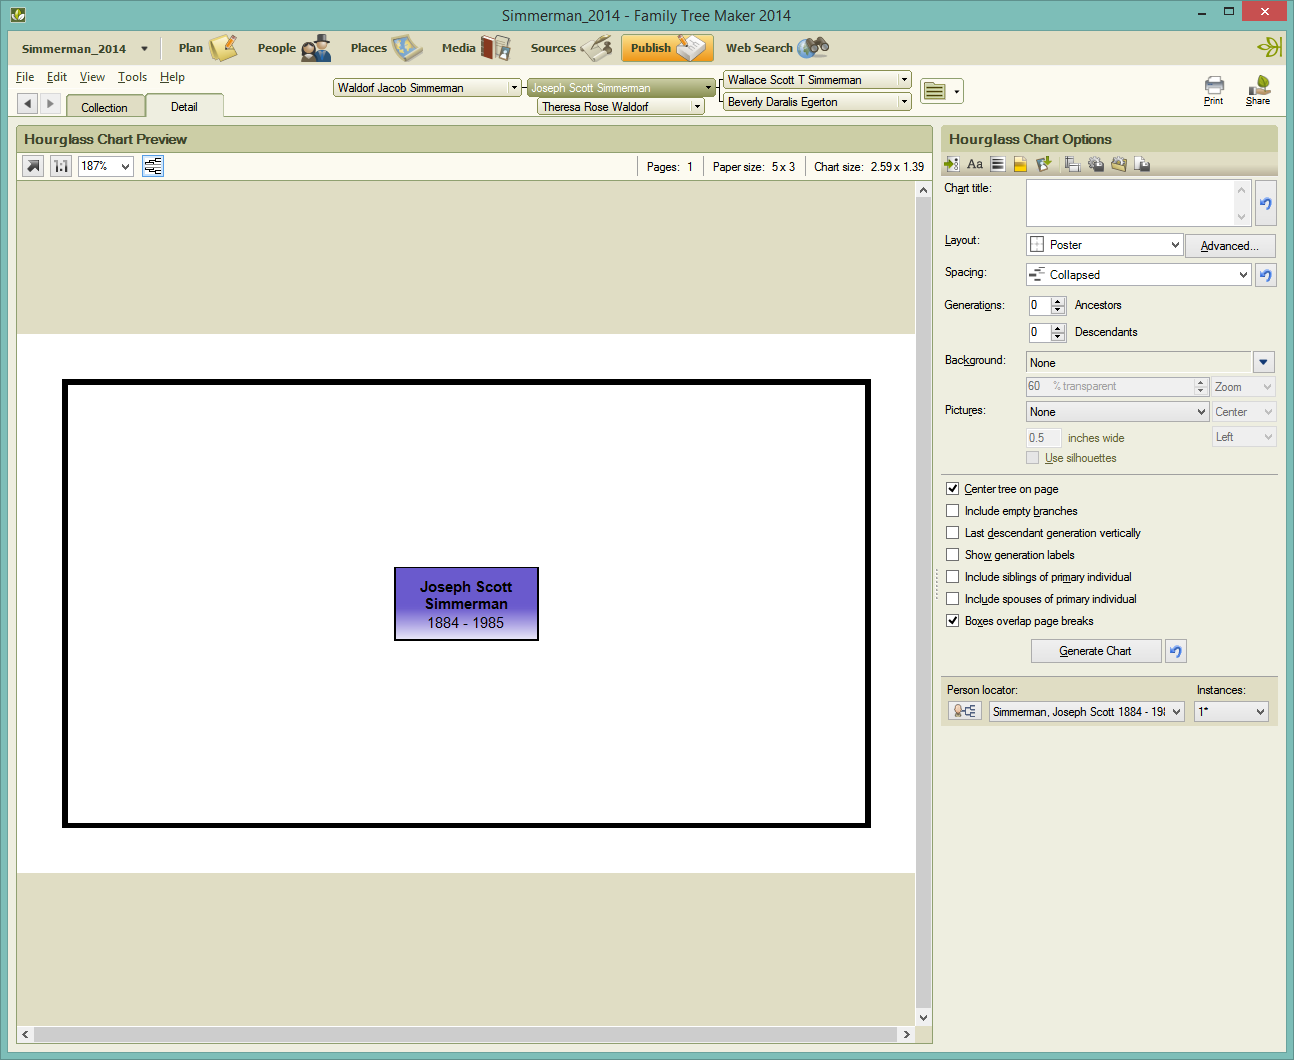
To set the 3D border on a chart box, open the Box, Border, and Line Options dialog, click in the Boxes list at the top left, and hold the Control Key and press the 3 key (not the 3 on the numeric key pad)..
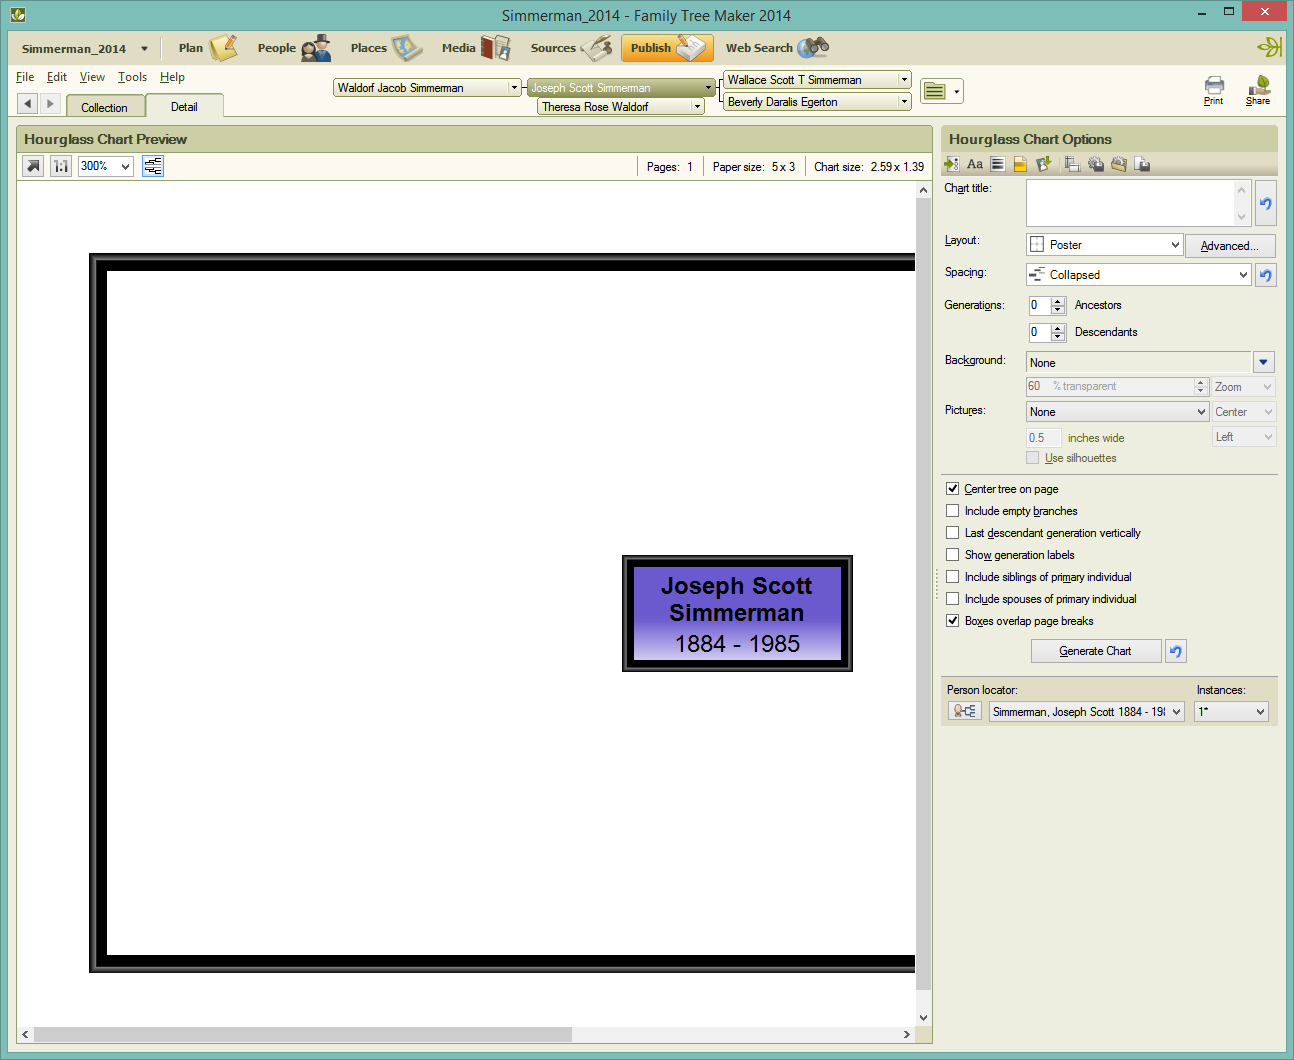
Chart Border
To set the 3D border on a chart, open the Box, Border, and Line Options dialog, click in the Boxes list at the top left, and hold the Control Key and press the 3 key on the numeric keypad.
These hidden features in combination with carefully select font colors you can make very interesting presentations of your data.
Here I changed the font color for the name to be white, used vertical transparency on the box, and it gives a very nice presentation that focuses the eye on the name.
Inserted Images
The undocumented features for inserted images are:
- Cycle through border options including undocumented borders
- Cycle through the fill / aspect ratio options
- Change the transparency of the image
- Control layout of multiple images
- Align top edges
- Align bottom edges
- Align left side
- Align right side
- Center
- Make the same size
- Change the z-order (which box is on top of another)
First, insert an image into your chart.
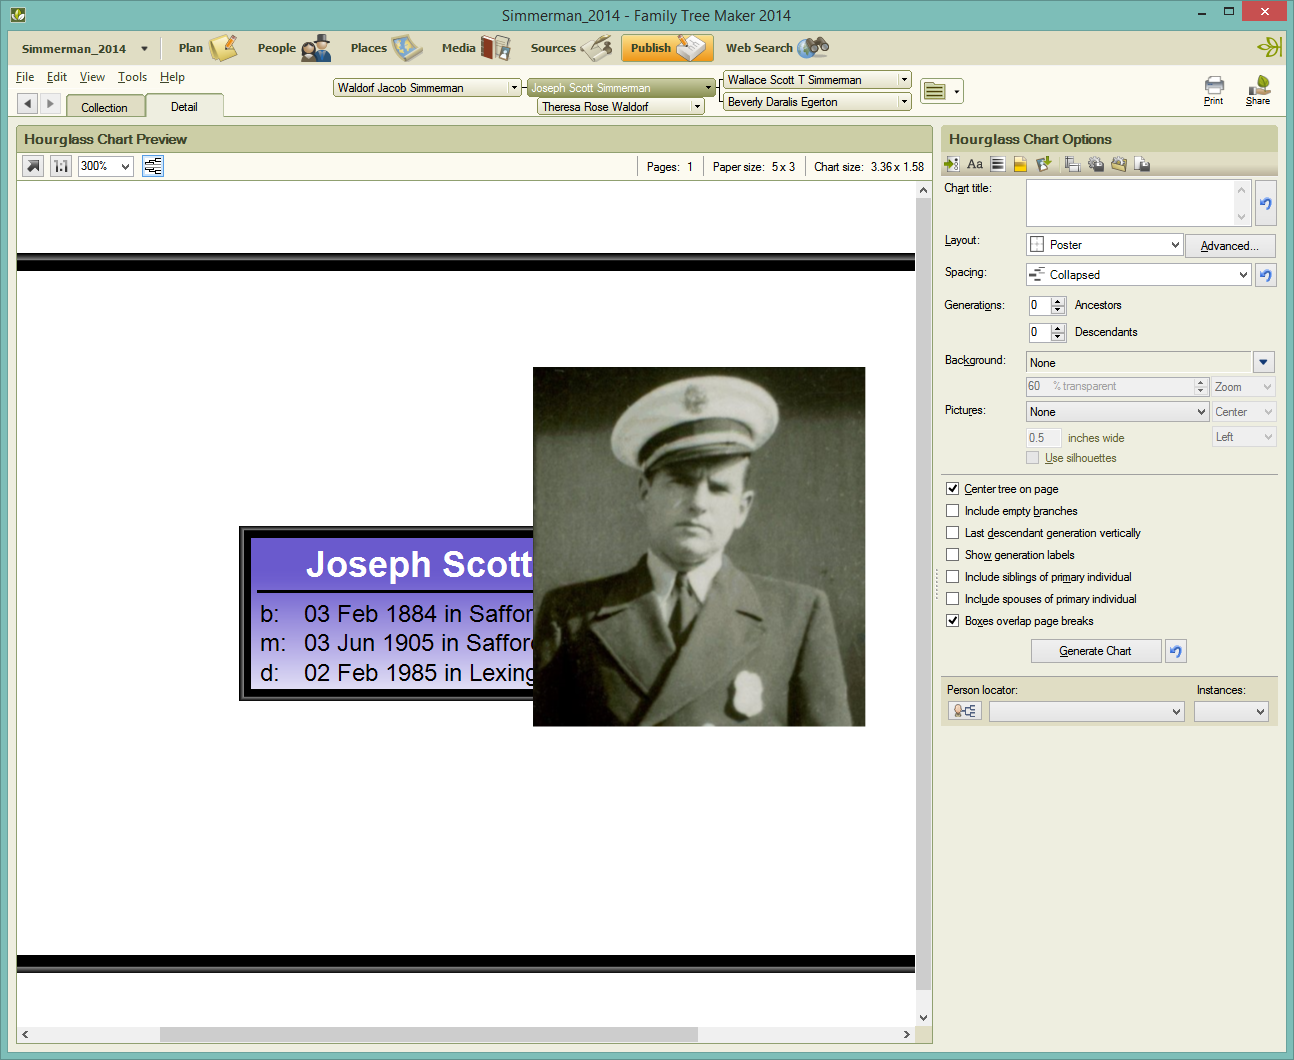
Click on the image and then hold the Control key and press the left bracket [. Stop on the border you like.
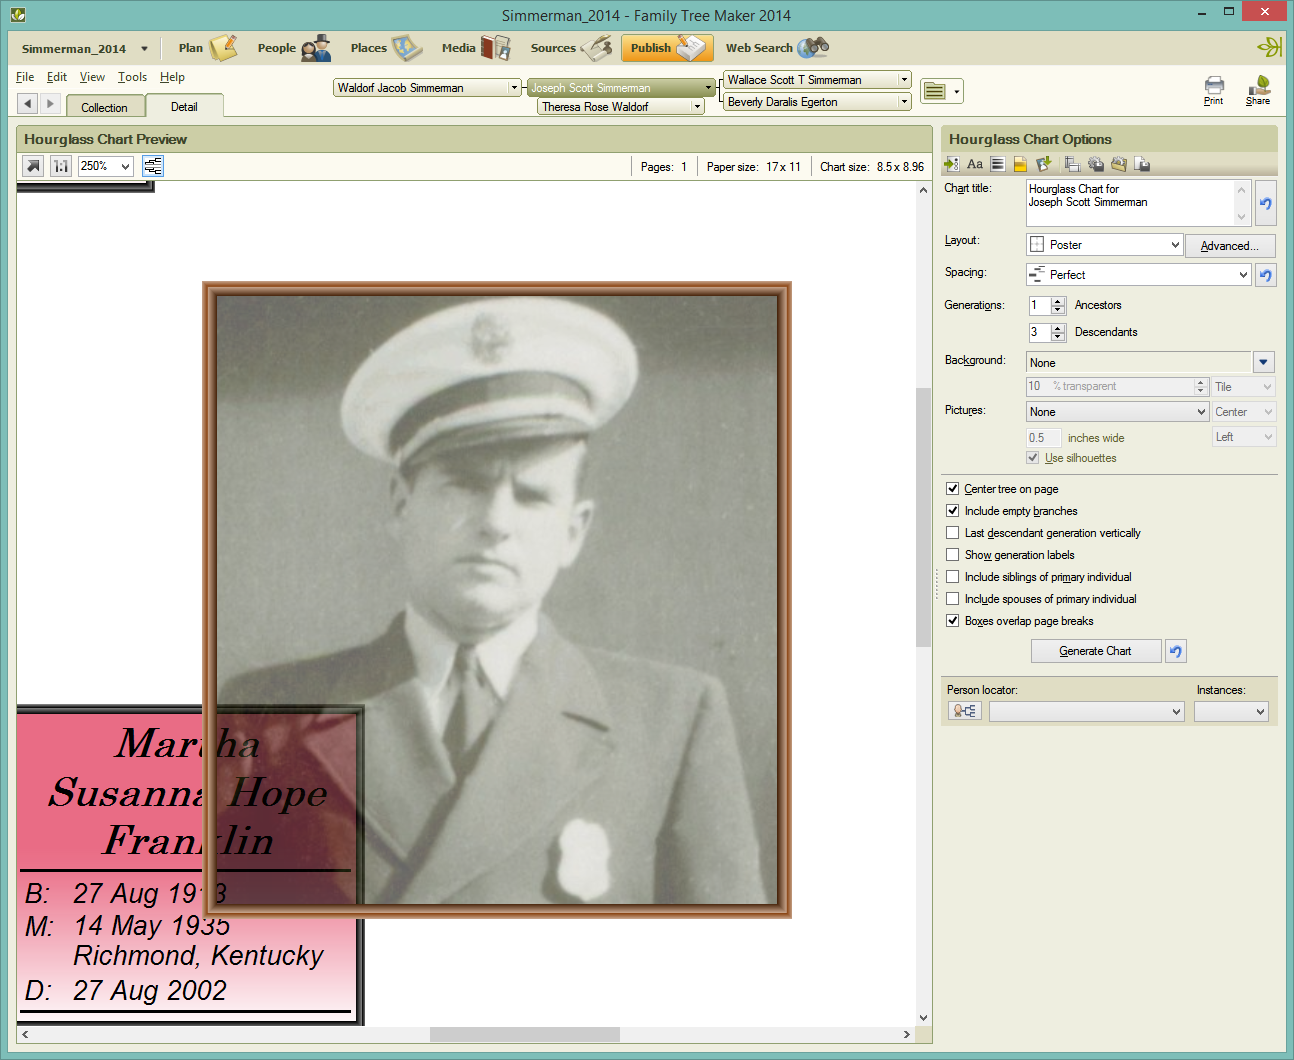
If you change the size of the inserted image it can affect the aspect ratio or how you want the image displayed. With the image selected hold the Control key and press the right bracket ].
Here is an example of the image stretched to fill. It is not something I would do in this particular case, I just wanted to show you what it looks like.

To change the transparency of an inserted image, select the image and hold the Control Key and press the plus or minus key.
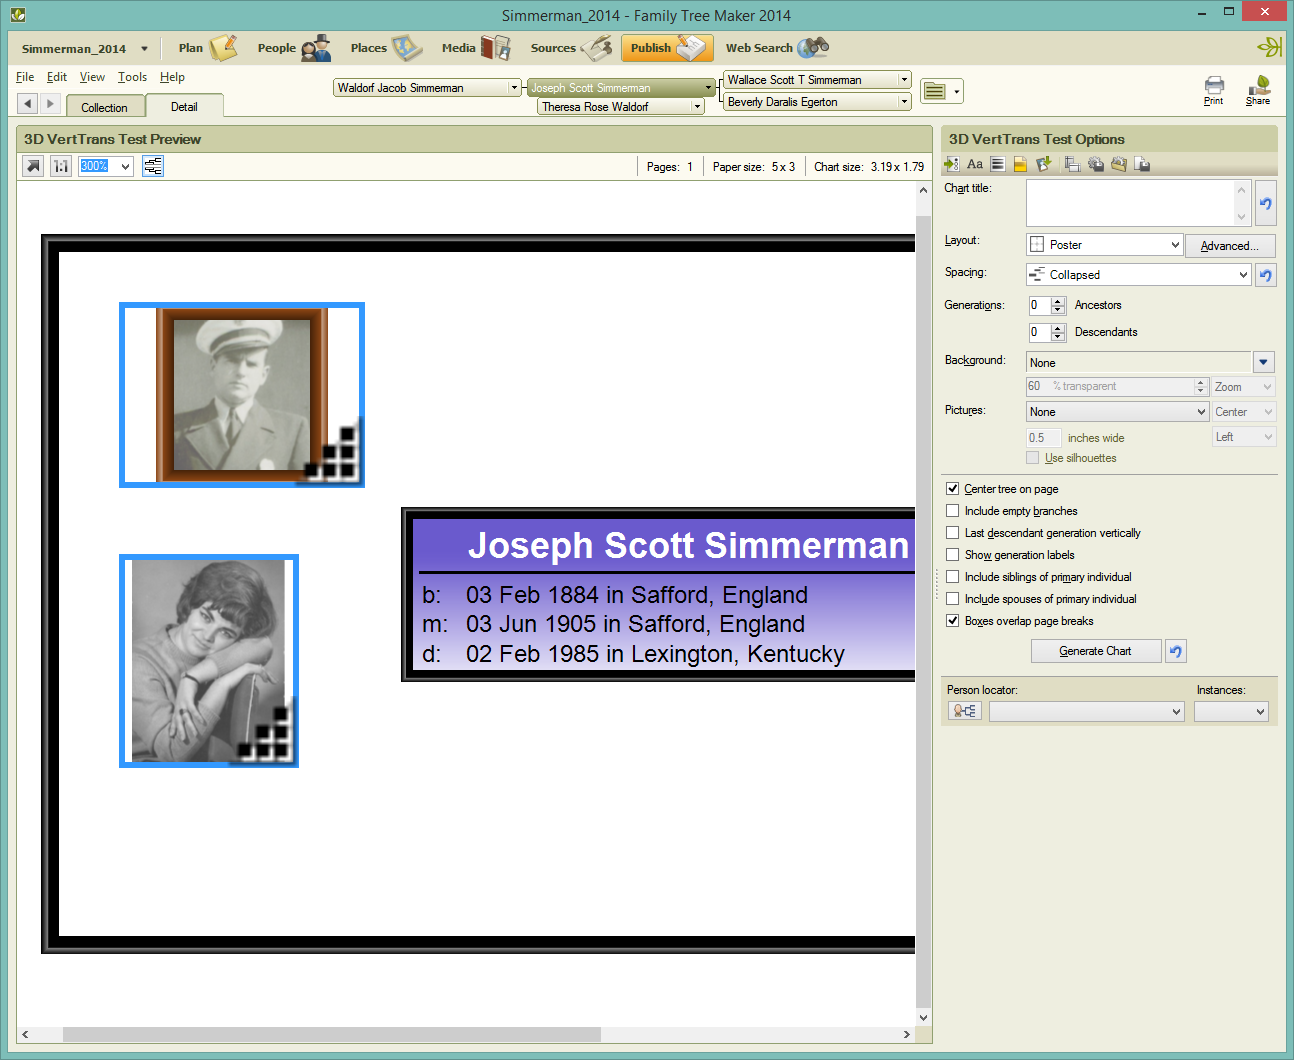
To select something hidden you can hold down the Alt key when you click and it will “drill through” to select the object behind.
“Right click” or what I like to say, “Alternate click” your mouse to bring up the popup menu for the image and move it to the back and you can see the transparency in action on both the node and the image.

If you have multiple images that you want to manipulate, select the first image as the one to be the key, and then select the rest. Then hold the Control key and press on the numeric keypad:
- 8 align top edges
- 2 align bottom edges
- 4 align left edges
- 6 align right edges
- 5 center
- 1 make same size
Here are two images:
I held the Shift key and click on the top image and then the bottom to select them both.
Hold the Control Key and press 4 on the numeric key pad:
Now the left edges are aligned.
Silhouettes
The standard silhouettes may not be want you want for your chart.
If you hold down the Control key when you check “Use Silhouettes” it will use the “fancy” image.

If you create PNG files named:
- male.png
- female.png
- unknown.png
and place them into the “Family Tree Maker” directory (typically found in your Documents directory) the app will use those if you hold Control and Shift when you click on the “Use Silhouettes” check box.

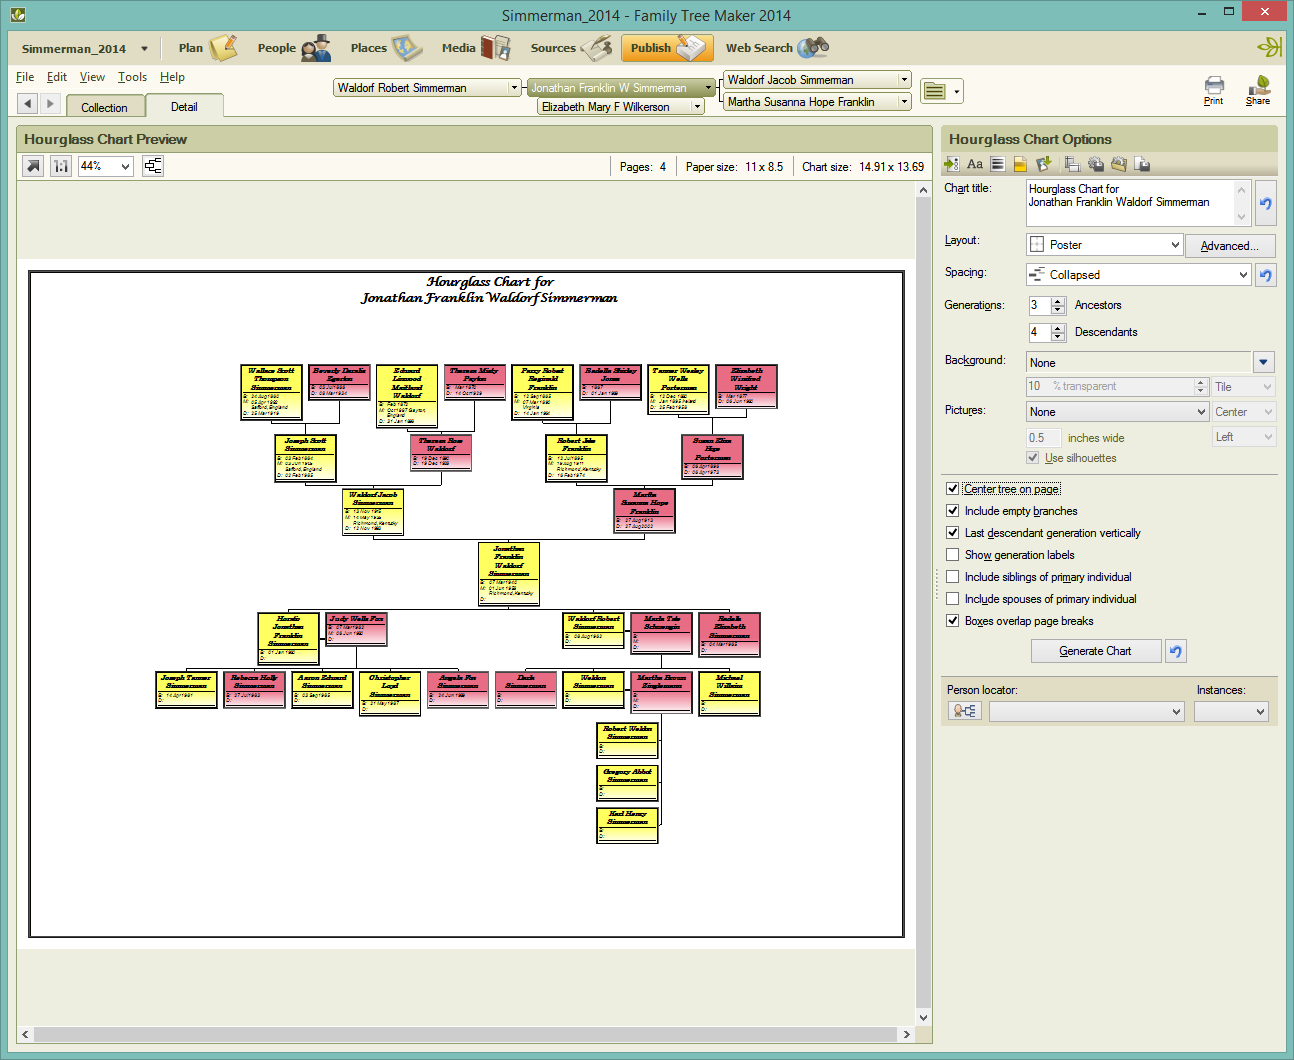
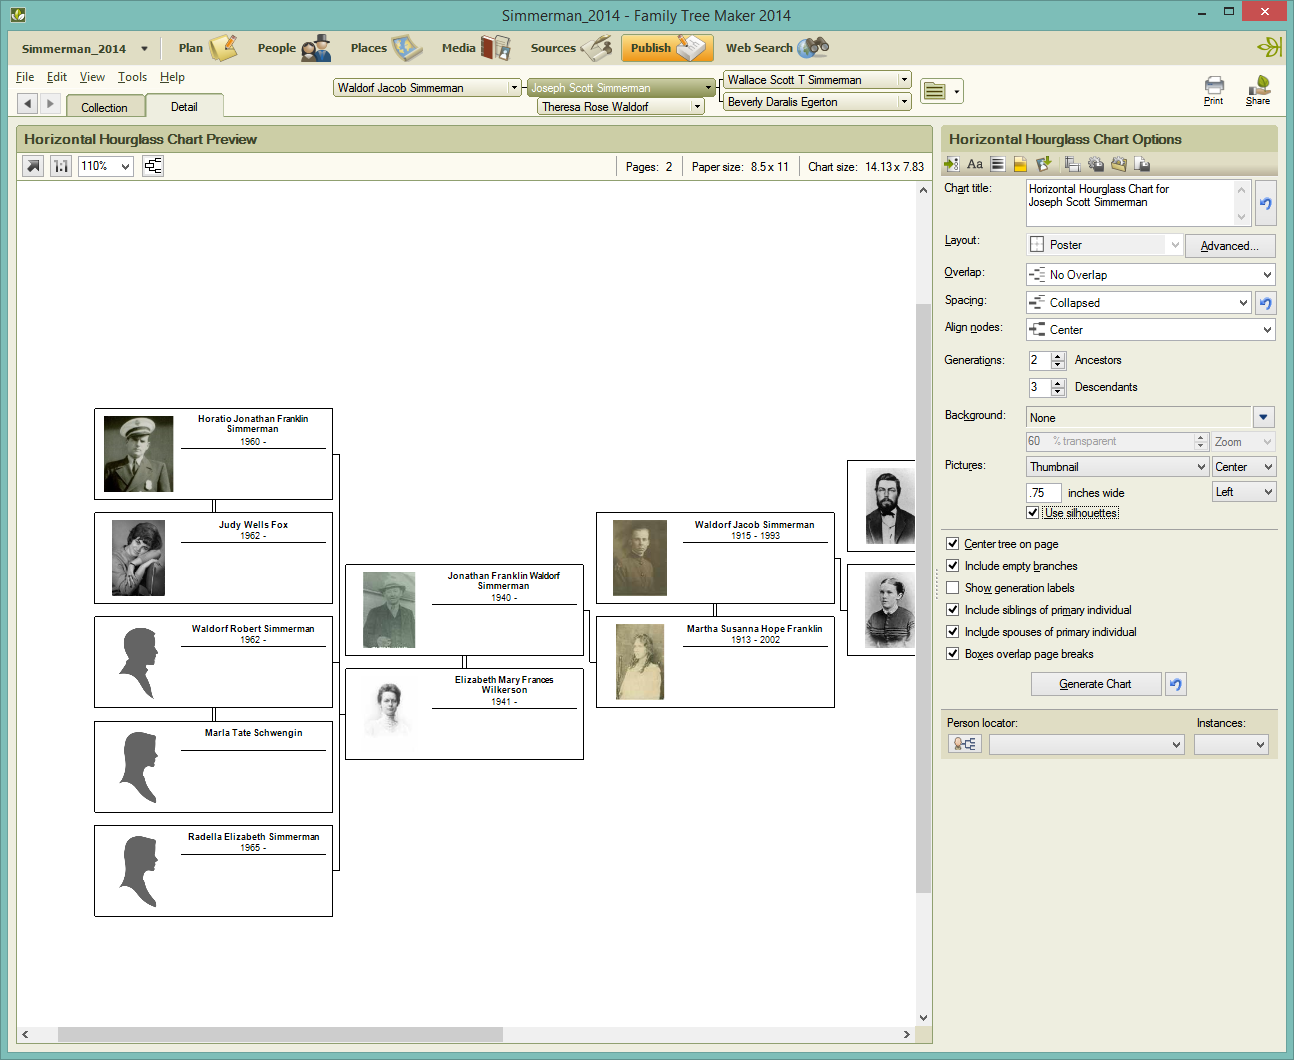
Vertical Last Generation
On most of the vertical charts you can check the last generation to be shown vertically.
Here is a descendant chart.
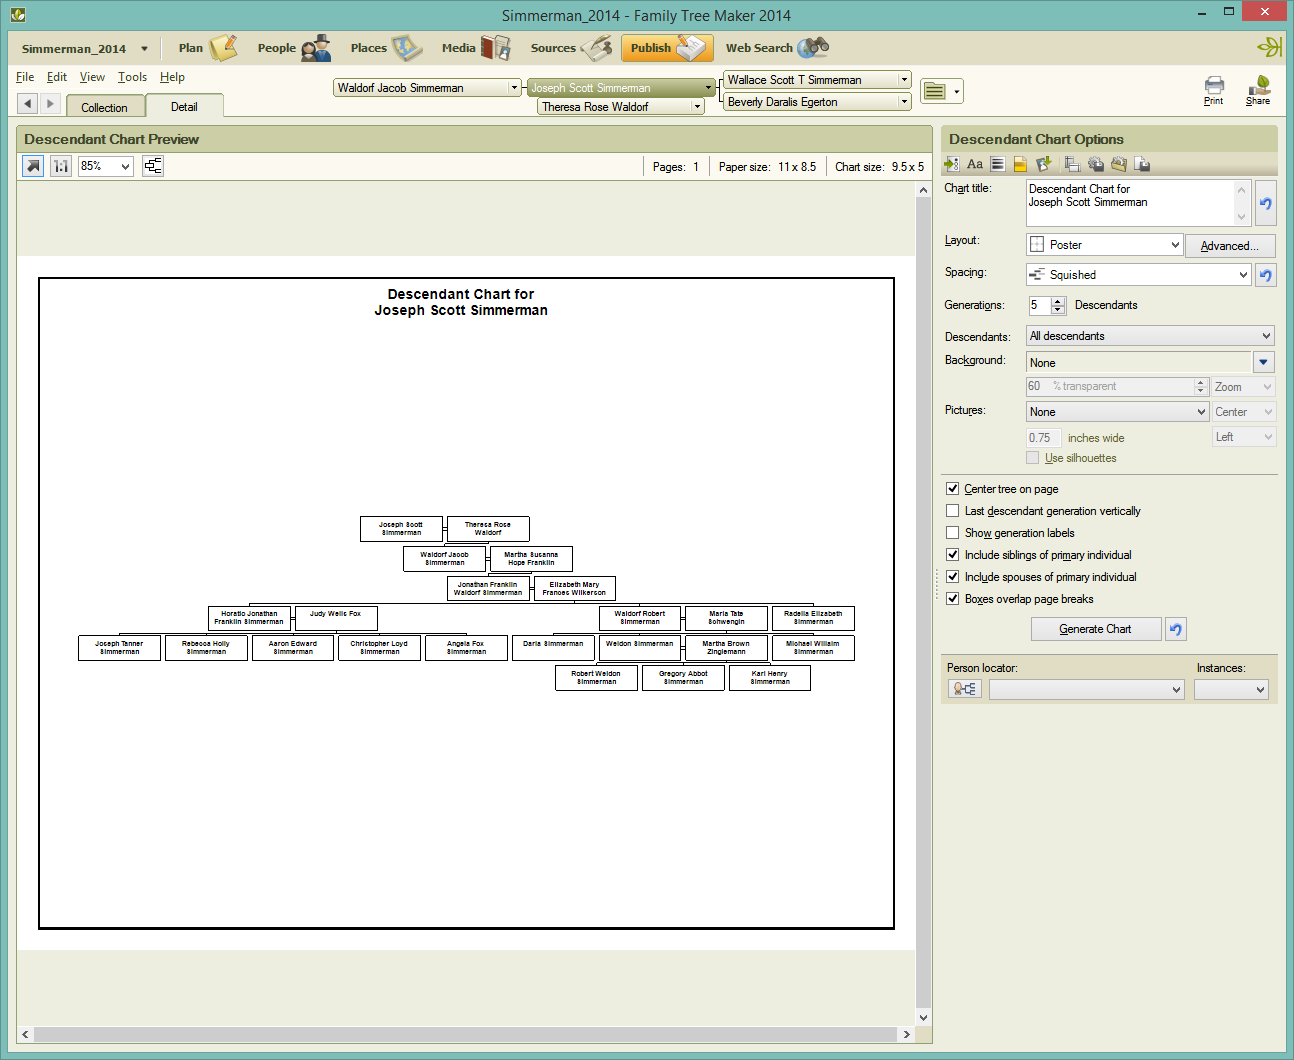
If you check “Last descendant generation vertically” you get this:
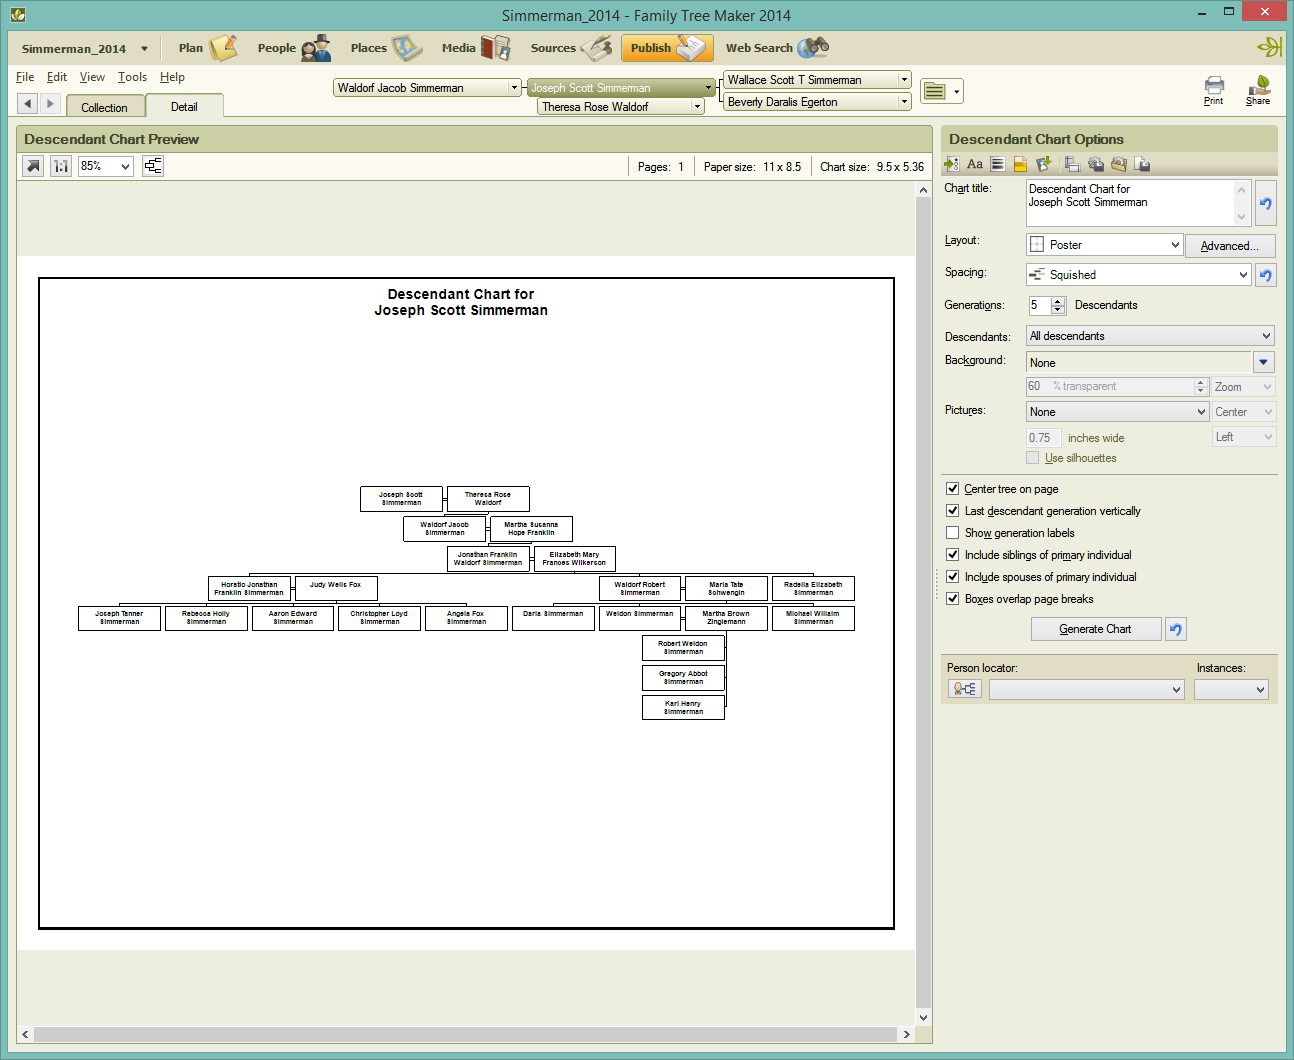
If you hold down the Control key when you check the “Last descendant generation vertically” it will look at the last generation of each branch instead of the last generation of the entire tree and lay out those vertically and decrease the width of the chart.

Conclusion
These undocumented features found in the Windows version of Family Tree Maker are features I was working on and never finished. They are undocumented, unsupported, and untested. Only use these features on a copy of your FTM data. Don’t be the one that finds a critical bug in this untested code that messes up your only copy of your data.
Feel free to share the link to this post, but do not copy the contents of this post. This is not public domain information.